Install Splunk Enterprise in Linux
In this article wel explore how to Install Splunk Enterprise in Linux environment. You'll know by now that Splunk is a powerful tool that helps you get intelligence of what is happening on your network in long term basis. Before you start syslogging your data into Splunk, read this article about how to logically prepare a plan to gather the logs for your infrastructure:
Splunk could be quite confusing due to the nomenclature that they use. There is plenty info in http://docs.splunk.com as well as in http://answers.splunk.com, but both sources could be an absolute nightmare (literally a pain in the butt), as they are full with links within links... within links, with not a clear solution at hand when something goes wrong. Let's revise some of the terminology that Splunk uses, so we get to an agreement in this article in regards to the semantic:
Indexer = This is the server where you install Splunk Enterprise, if you have use a single installation only, this server will also be known as the "Indexer", "Search Head" and "Deployment Server", quite a few titles for a single machine, ah? From now on we'll refer to this server as Indexer only, the name of Splunk should not be use to designated this server (e.g. "the splunk server") as this is both confusing and incorrect ("do you mean Splunk as the Indexer Splunk server, or the Splunk Search Head, etc?").
Forwarder = This is a client (windows and/or unix system) that sends data to the Indexer. It is in the clients where you install the Splunk Universal Forwarder, then use the Forwarder Management option in the Indexer to deploy add-on apps remotely into the clients
Apps Dissection = The different packages that Splunk uses should be installed as follows:
- App = They go into the Indexer only and provide front end visualisation of the data
- Add-on = They go both to the Indexer and the Forwarders, and provide back end functionality (scripts, APIs, data parsing config, etc)
- Technology add-on (TA) = They go to both the Indexer and the Forwarders
outputs.conf file in the Forwarder ;this file is located in the /opt/splunkforwarder/etc/system/local if your Forwarder is a Linux, and what it does is sending the logs to the Indexer, your Splunk server, the file contains the IP address of your Indexer
Here a summary of the sections I've covered in this article, hope you like it and above all that you enjoy it!
- Installing Splunk
- The Indexes
- Extend the partition in your Linux Splunk VM
- Install the Universal Forwarder in your Windows servers (GPO)
- Installing app: Windows Events Logs Analysis
- Collectd for Linux VMs
- Install collectd in the client
- Troubleshooting
- Install collectd in macOSX
- Cisco App
- GMail Suite
- Sophos Central App
- 3CX calls into CDR
Get your VM ready with CentOS 7 (I have it with 6GB of RAM and 300GB hard drive size to start with), and then either create a personal account in Splunk or login to this site if you already have an account:
Download the release for whichever version you have the license for, and be brave and install it on your VM. Be sure to have plenty space on "centos_splunk8-root" drive, on my case I created with over 300GB
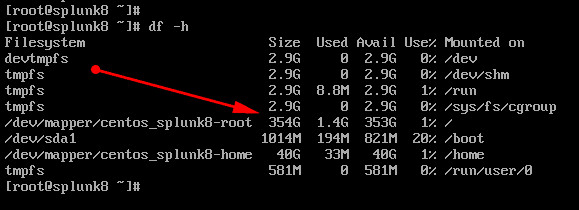
If you don't have the wget command on your VM, do this:
sudo yum install wget
sudo yum install net-tools
- To obtain the release you can also use the wget command; of the example below I'm using the version 6.5.3, and this is the wget URL taking from the download page:wget -O splunk-6.5.3-36937ad027d4-linux-2.6-x86_64.rpm 'https://www.splunk.com/page/download_track?file=6.5.3/linux/splunk-6.5.3-36937ad027d4-linux-2.6-x86_64.rpm&ac=&wget=true&name=wget&platform=Linux&architecture=x86_64&version=6.5.3&product=splunk&typed=release'
- If you are upgrading to 7.3 using this link instead: wget -O splunk-7.3.0-657388c7a488-linux-2.6-x86_64.rpm 'https://www.splunk.com/bin/splunk/DownloadActivityServlet?architecture=x86_64&platform=linux&version=7.3.0&product=splunk&filename=splunk-7.3.0-657388c7a488-linux-2.6-x86_64.rpm&wget=true' , then execute the command rmp -U splunk....rpm after obviously making the file executable
- To install the release 8.1.2, run this: wget -O splunk-8.1.2-545206cc9f70-linux-2.6-x86_64.rpm 'https://www.splunk.com/bin/splunk/DownloadActivityServlet?architecture=x86_64&platform=linux&version=8.1.2&product=splunk&filename=splunk-8.1.2-545206cc9f70-linux-2.6-x86_64.rpm&wget=true'
After the download, do these two commands:
chmod + x splunk....
rpm -U splunk....
Get privileges rights on your VM and issue the above command on it (ensure before that you get proper DNS resolution!). After that download finished, verify that you have the .rpm file on your area:

Then, do the following:
chmod o+x splunk.....rpm ;ensure that file is executable by the root
su
groupadd splunk
useradd -d /opt/splunk -g splunk splunk
rpm -i splunk...rpm
After you "install" splunk, visit the location /opt/splunk/bin ,then issue:
chown -R splunk: /opt/splunk
firewall-cmd --set-default-zone=trusted
firewall-cmd --zone=trusted --add-port=8000/tcp --permanent
firewall-cmd --reload
cd /opt/splunk/bin
./splunk start
Enter "Y" to agree the license, and if you're installing version 7.2 enter the "admin" and "yourNewPasswd" for the Splunk web interface. If you're installing an older version, ensure that the splunk services are up, then visit http://yoursplunkserver:8000 to choose your super-duper-secret password
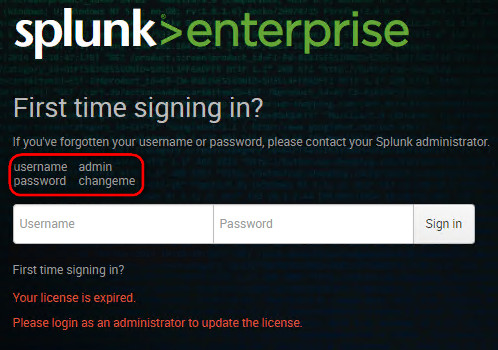
If you have your splunk.license file at hand, install it using the web interface. Notice that the installation gives you these very different locations:
- Path to installation: /opt/splunk
- Path to indexes: /opt/splunk/var/lib/splunk
- Path to apps: /opt/splunk/etc/apps
And, of course, ensure Splunk is enable at boot start
./splunk enable boot-start
Splunk will use the "main" index by default, putting all data in there, which inevitably will become messy in the future, so please ensure from the start that you carefully created a dedicated index for each App that you're going to install on Splunk. Create a naming convention for your indexes and stick to it!
Extend the partition in your Linux Splunk VM
Sooner or later, you're going to run out of space in your Indexer VM. If it is running Linux, shut it down and extend the drive (add it 100GB more if you can) to the single VMDK drive that you should have, then follow this list of commands to extend the root partition
df -kh #see the free space available
lsblk #see the partition on a tree
yum -y install cloud-utils-growpart
growpart /dev/sda 2 #grows the partition 2 of sda
pvs #verify the volume
pvsresize /dev/sda2 #resize the physical volume
vgs #check it one more time
df -hT | grep mapper #get the name of the volume
lvextend -l +100%FREE /dev/mapper/centos-root #finally, increase the volume
xfs_growfs / #reprot the right size
I credit this work to Josphat Mutal, thank you! https://computingforgeeks.com/extending-root-filesystem-using-lvm-linux/
3. Install the Universal Forwarder in your Windows servers (GPO)
This is dead easy, just download the .msi file from the Splunk website and do next, next, enter your credentials, Indexer details, etc. The best way, however, is to use a GPO to do this in the event that you are administering a domain.
- Logon to the Splunk website, and download the Universal Forwarder from here: https://www.splunk.com/en_us/download/universal-forwarder.html
- You'll also need to install a wonderful application called Orca, download it from here: https://www.technipages.com/software-downloads
Once you have the .msi file and the Orca application open, import the msi file using ORCA > visit the property are and enter these properties with your corresponding values:
AGREETOLICENSE = Yes
SPLUNKUSERNAME =
SPLUNKPASSWORD =
DEPLOYMENT_SERVER = 192.168.0.x:8089

After saving the msi file, open a run command window (press Windows + R) and drag the msi file into the box, then test the installation by adding the qb+ string at the end and press enter
/qb+

The installation should be completed without any prompts, as the qb+ switches simulates an installation as if it was from a GPO deployment. If you get the error "installation ended prematurely", download the Windows Installer Clean Up tool and choose to remove the Universal Forwarded and start a new installation

The Windows Installer Clean Up tool (msicuu.exe) is notoriously difficult to find on the web nowadays for some reason. If you can't get hold of it, send me an e-mail and let's see what I can do ;)
4. Installing app: Windows Events Logs Analysis
A good one to have is this: https://splunkbase.splunk.com/app/3067/ from EventID.net, particularly useful is the Windows Event Summary dashboard, specially the "Errors" and "Warnings" boxes, that tells you exactly where to look in the tons of logs you receive from your servers

As you should know by now, to install this app simply extract the folder from the zipped file and drop it into /opt/splunk/etc/apps using WinSCP, thereafter...you guess it... restart Splunk
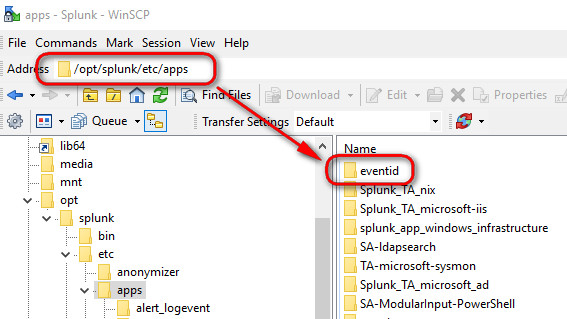
If this app doesn't work for you, ensure that you have these two files present inside the folder "local":
app.conf #to be found under /eventid/local
[install]
is_configured = 1
macros.conf #to be found under /eventid/local
[event_sources]
disabled = 0
[event_sources_xml]
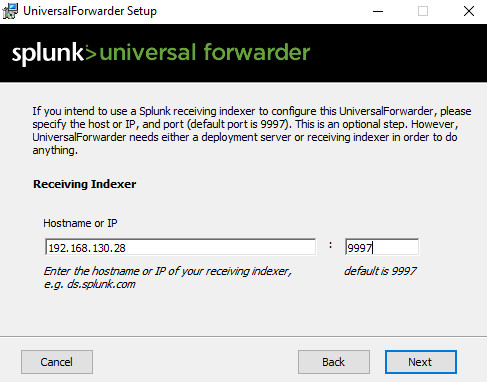
And then... yes, after you had those two files... restart Splunk! Finally, install the Splunk Universal Forwarded on the Windows Forest Root Domain Controller so that it can start logging data to Splunk. You need to enter the admin password for your Splunk Enterprise during the installation wizard
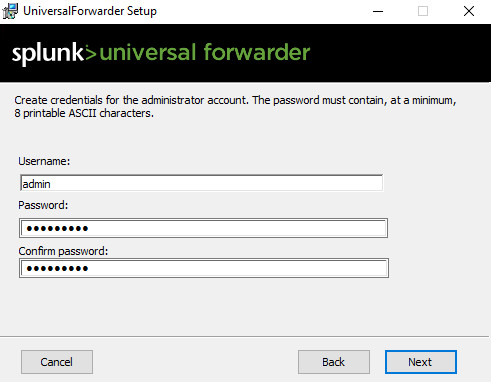
And leave the port 9997 as default
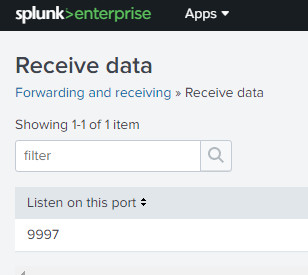
Ensure that on your Splunk Enterprise you visit Settings >>> Forwarding & Receiving >>> Configure Receiving and add port 9997 to receive data on the EventID app
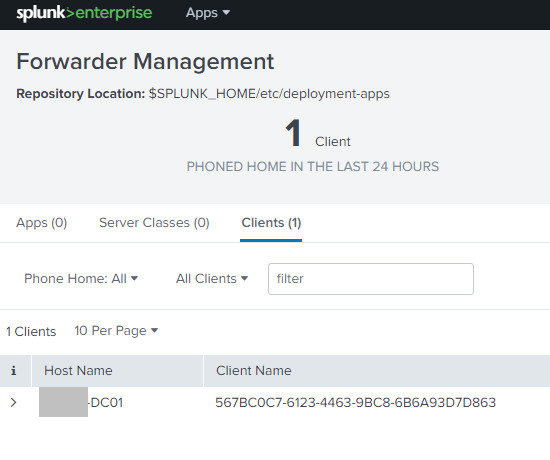
And to confirm, check the Settings >>> Forwarder Management and you should see in there the DC in which you installed the Universal Forwarded, calling home
If you still get no data on the Splunk, visit the DC and ensure this "inputs.conf" file exists under the "local" folder in C:\Program Files\ SplunkUniversalForwarder\ etc\apps\SplunkUniversalForwarder\ local
[WinEventLog://Security]
checkpointInterval = 5
current_only = 0
disabled = 0
start_from = oldest
[WinEventLog://System]
checkpointInterval = 5
current_only = 0
disabled = 0
start_from = oldest
[WinEventLog://ForwardedEvents]
checkpointInterval = 5
current_only = 0
disabled = 0
start_from = oldest
[admon://NearestDC]
monitorSubtree = 1
[perfmon://CPU Load]
counters = % Processor Time;% User Time
instances = _Total
interval = 10
object = Processor
[perfmon://Available Memory]
counters = Available Bytes
interval = 10
object = Memory
[perfmon://Free Disk Space]
counters = Free Megabytes;% Free Space
instances = _Total
interval = 3600
object = LogicalDisk
[perfmon://Network Interface]
counters = Bytes Received/sec;Bytes Sent/sec
instances = *
interval = 10
object = Network Interface
Visit this link and download to your Indexer the Collectd App for Splunk Enterprise and for information about how to use the app: https://splunkbase.splunk.com/app/2875/ To download the app you will have to visit the github website here: https://github.com/nexinto/collectd
Once you installed the app in your Indexer....
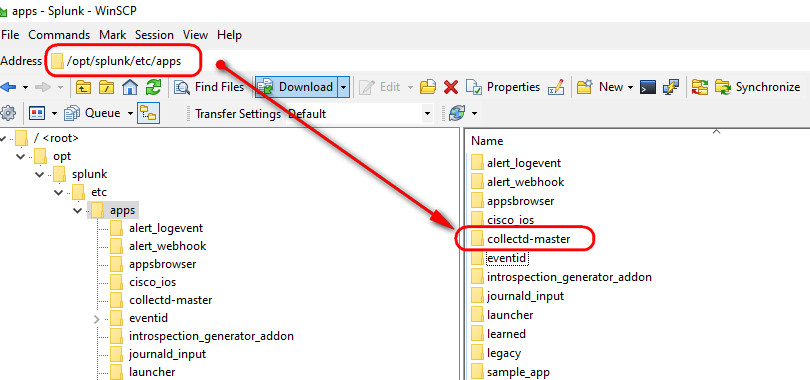
...proceed to install the program collectd in your Linux VM clients as below:
Install collectd in the client
Before starting, ensure that you have a DNS Reverse Lookup Zone configured for those VMs where you'are going to install collectd, otherwise the app with show the VMs with their IP addresses instead of the FQDN
For this app to work we first need to install the daemon collectd in our Linux box, you can read more about it in here https://collectd.org/download.shtml To download it and install it, execute these commands:
yum install epel-release
yum install collectd
yum install collectd-netlink
systemctl enable collectd ;the service will start upon boot
systemctl stop collectd ;ensure that the service is stopped for the minute
Just for info, use the --help switch to find out the main location of the collectd files
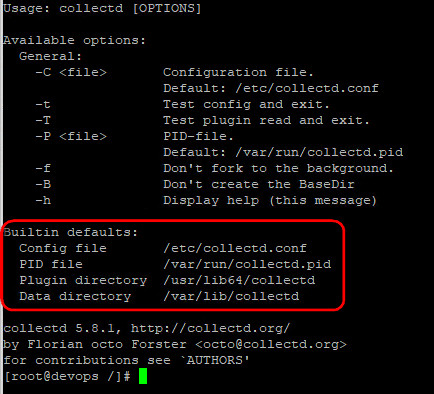
Issue this command in your Linux VM:
mv /etc/collectd.conf collectd.conf.OLD
touch /etc/collectd.conf
Using vi edit the newly created collectd.conf file and populated with this:
Hostname devops
FQDNLookup false
Interval 300
LoadPlugin syslog
LoadPlugin memory
LoadPlugin cpu
LoadPlugin df
LoadPlugin disk
LoadPlugin interface
LoadPlugin load
LoadPlugin processes
LoadPlugin swap
LoadPlugin write_graphite
LogLevel info
Host "192.168.0.44"
Port "10001"
Protocol "tcp"
Include "/etc/collectd.d"
Change the "hostname" to your choice, and edit the "write_graphite" plugin to point to your indexer IP address, then start the service
systemctl start collectd
To test the configuration between the client and the Indexer, run this command on the client:
tcpdump -i ens192 -p -n -s 1500 tcp port 10001
Also, check that the process is running by executing:
ps aux | grep collectd
Troubleshooting
If not data is coming to the app, issue the command "systemctl status collectd -l" and see what it says. If you get the error message "write_graphite plugin: Connecting to 192.168.0.x:10001 via tcp failed. The last error was: failed to connect to remote host: Permission denied" that means that SELinux is blocking the traffic, no matter if you have allowed the port on the firewall, SELinux still will block the traffic. To bypass this you have got two options:
1. Disable SELinux:
#Edit the file /etc/selinux/config and set this option:
SELINUX=disabled
#then reboot your machine
2. Allow collectd through SELinux:
This is a tricky one, but you can do that by following this tutorial: https://www.systutorials.com/docs/linux/man/8-collectd_selinux/
Install collectd in macOSX
Before you start, ensure you have an entry in the DNS Reverse lookup zone for the machine you want to install collectd. To install collectd in your iMac, logon to it using ssh and run this command:
- ruby -e "$(curl -fsSL https://raw.githubusercontent.com/Homebrew/install/master/install)" < /dev/null 2> /dev/null
If the screen prompts you to enter a password, please enter your Mac's user password to continue. When you type the password, it won't be displayed on screen, but the system would accept it. So just type your password and press ENTER/RETURN key. Then wait for the command to finish. Once you're back to the console, enter this command:
brew install collectd
The conf file is in /usr/local/etc/collectd.conf which is a symbolic link, the original file reside in /usr/local/Cellar/ collectd/5.9.0_1/etc/collectd.conf ; do the following to rename the file:
- mv /usr/local/Cellar/collectd/5.9.0_1/etc/collectd.conf collectd.conf.OLD
- touch /usr/local/Cellar/collectd/5.9.0_1/etc/collectd.conf
The edit the /usr/local/etc/collectd.conf file and enter these contents, changing the IP address to that of your Splunk server (on my example is 192.168.0.40):
#File for macOSX
Interval 300
LoadPlugin syslog
LoadPlugin memory
LoadPlugin cpu
LoadPlugin df
LoadPlugin disk
LoadPlugin interface
LoadPlugin load
LoadPlugin processes
LoadPlugin swap
LoadPlugin write_graphite
LogLevel info
Host "192.168.0.40"
Port "10001"
Protocol "tcp"
Then paste the linux entries
sudo brew services start collectd #enter your admin password
sudo brew services restart collectd
To check for errors visit: cat /usr/local/var/log/collectd.log
To test the CPU load on the iMac, and see if it reports the spike in the Indexer app, run these commands in the terminal iMac:
yes > /dev/null & yes > /dev/null & yes > /dev/null & yes > /dev/null &
To stop the test, run this:
$ killall yes
For Smarmoon tools in macOSX do:
brew install smartmoontools
If you have Cisco devices on your network, oh yeah, go and download these two goodies:
- https://splunkbase.splunk.com/app/1352/ - Cisco Networks App for Splunk Enterprise
- https://splunkbase.splunk.com/app/1467/ - Cisco Networks Add-on for Splunk Enterprise
As usual, use WinSCP to copy these two folders into the /opt/splunk/etc/apps location of your Indexer, then restart the splunk service
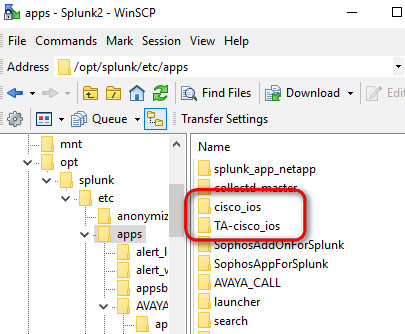
Once you have done it, yeap, reboot your Splunk Indexer. After the system is up, verify that you have Data Input 714 UDP pointing to a index called "cisco". To start populating the app with data, enter this command in your Cisco switches, changing the IP address for that of your Indexer
(config)#logging host 192.168.0.40 transport udp port 714
Yes, this is what you need to verify that you have configured on your Splunk server:

If you are running Gmail in your business, go ahead and install these two apps:
- Input Add-On for G Suite App: https://splunkbase.splunk.com/app/3793/
- G Suite for Splunk: https://splunkbase.splunk.com/app/3791/
You'll need to create a "Google-vs-Splunk" project in your Google Developers Accounts, to do this follow Nick von Korff great article:
If you have Sophos Central in your environment, don't miss installing these two wonderful apps:
- TA Sophos Add-on for Splunk https://splunkbase.splunk.com/app/4096/
- APP Sophos App for Splunk https://splunkbase.splunk.com/app/4097/
If you are running 3CX on your network, there is a way to have the number of calls received to be logged in Splunk... that might not sound very useful and is definitely better than nothing. To do that first of all create an account with ThridLane, and download from their website the Freemetrics app for Splunk: https://www.thirdlane.com/product/download There is a description of the app in the Thridlane web portal that you can read: https://www.thirdlane.com/products/thirdlane-freemetrics
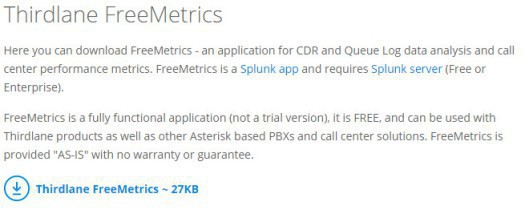
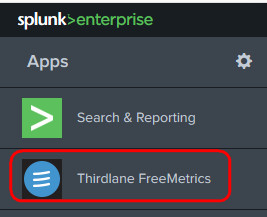
You'll download a *.spl file, one you have done that logon to your Splunk Enterprise > visit the Apps and click on "Install app from file"

Select the 'Thridlane.spl' file you previously downloaded and click on "Upload"
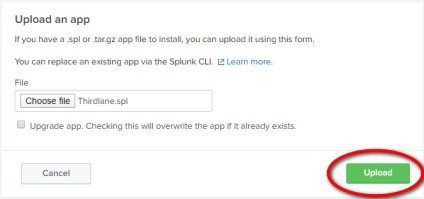
After the installation, you'll be asked to restart Splunk. Do so, and once the system comes back on line go and visit the newly added app to open it
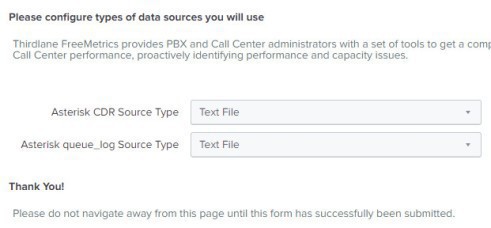
Select "Text File" as the source data type to enter into Splunk, this is because 3CX is only capable of exporting the data into text format
Still on your Splunk server, visit Settings > Data Inputs > TCP and create a "New Local TCP" input as below (notice I choose to log into the index called thirdlane):

For that Splunk app to work with 3CX, you need to change some strings in the app, which is by default configured to work with Asterisk instead of 3CX. To do that open a WinSCP connection to your Splunk server and visit the location /opt/splunk/etc/apps/Thirdlane/default/data/ui/views Once you're there, edit the filenames that contain "cdr" and change the follow:
Replace: "asterisk_cdr_$cdr_type$"
For: "asterisk_cdr_text"
Replace: "asterisk_queue_log_$queue_log_type$"
For: "asterisk_queue_log_text"
And finally, after doing all this, jump to your 3CX settings > CDR settings and add the CDR types "from-dispname" and "to-dispname" to the list, then configure 3CX CDR to point to your Splunk IP address
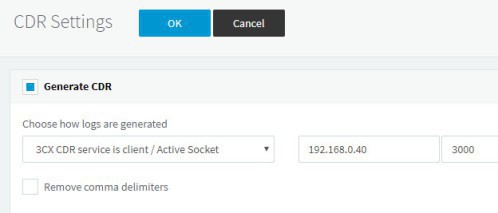
Reboot your Splunk service one last time, and then check the Thridlane app > CDR > Calls by Day, and you should be able to start seeing data on it
London, 2 March 2020
The following are a bunch of apps that I installed while doing this article, but didn't find them much useful to be honest. I recommend you to install "Collectd for Splunk Enterprise" to manage your Linux VMs, it is easy to use but most importantly.... it works!
These other apps that I list below did not fully worked for me, but I documented the installation process anyway
Installing an app: Avaya Call
Let's start by installing the Avaya Call (obviously, do it only if you happen to have an Avaya device on your network), and get experience with the app installation into Splunk. Download the app from this link https://splunkbase.splunk.com/app/1889/ and then using the WinSCP uploading (drag it) to the /opt/splunk/etc/apps location in your Linux Splunk VM
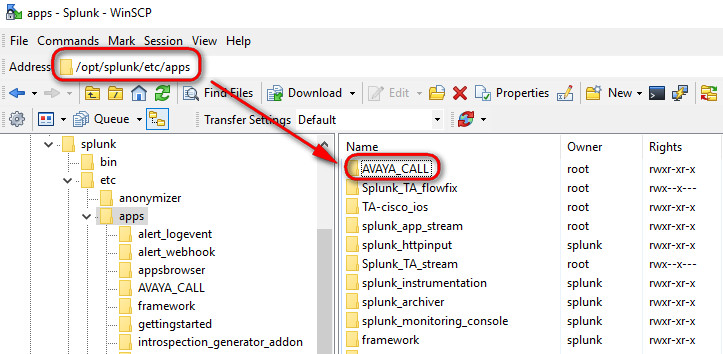
After you have copied the folder, gave the full ownership to it to the "splunk" user as well as the "splunk" group
chown splunk:splunk -R /opt/splunk/etc/apps/AVAYA_CALL
Restart your Spluk service for the installation to take effect
systemctl restart splunk
systemctl status splunk
Alternatively, visit Server Control > Restart Splunk
Once the service has successfully restarted, logon to Splunk webserver and visit Settings > Indexes > and create a new index called "App_[the app name]" for the new app that you have installed, set it to 100GB maximum size, 500GB which is the default is a bit crazy and pretty useless to be honest, it would take too long (and eventually time out) for splunk to search data that is older than 6 months, we're talking about thousands of logs!
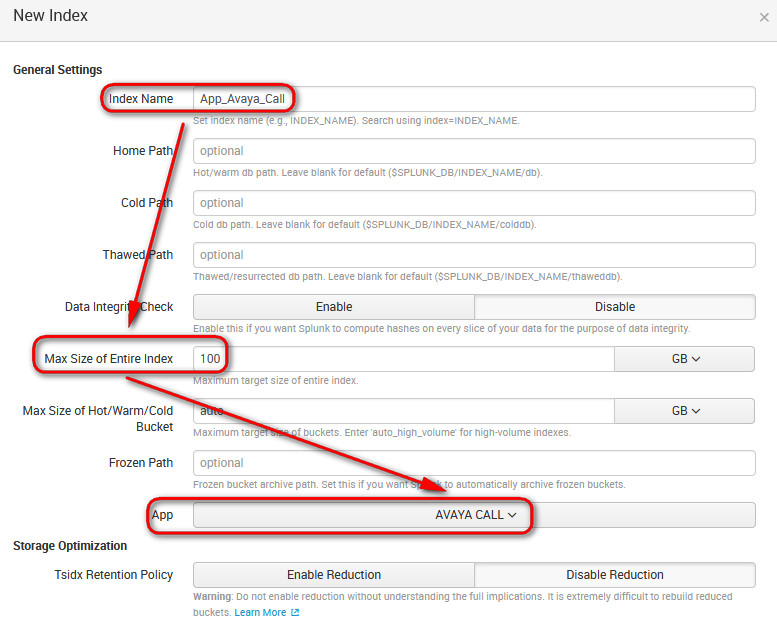
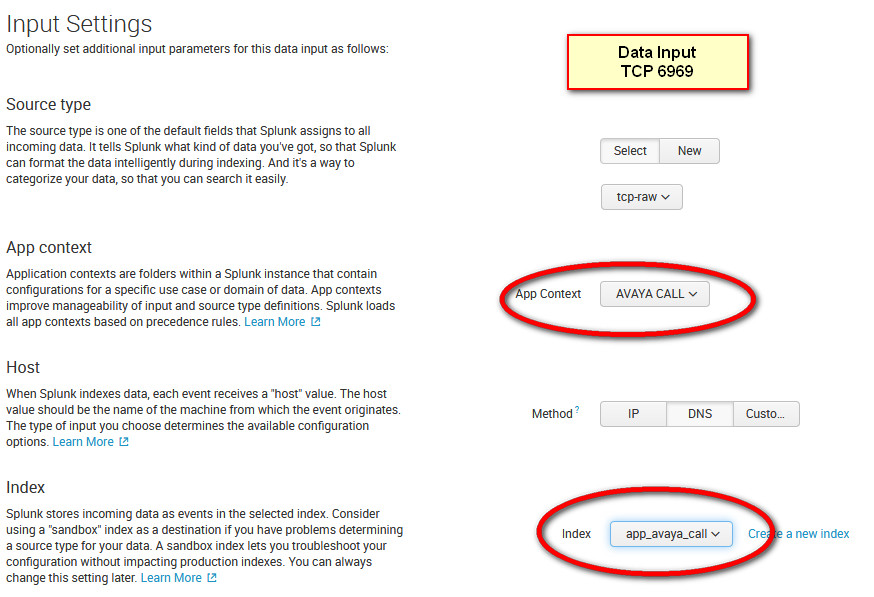
Once you got the index done, visit Settings > Data Inputs > Local Inputs TCP and create a new entry for port 6969 (the same port that you've configured in the Avaya PBX box)
Select source type > Uncategorize > tcp-raw and set the settings as advise on the configuration of the app in Splunk website
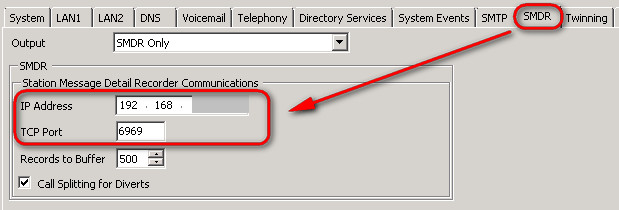
Finally, visit your Avaya PBX > Settings >SMDR and configure the IP of your Indexer in there together with the port 6969
Set the roles of the admin user to access the "ipo" index
Install the NetFlow gadgets
- Start by installing Splunk Stream from this link: https://docs.splunk.com/Documentation/StreamApp/7.1.2/DeployStreamApp/InstallSplunkAppforStream
Edit the file /etc/sysctl.conf and add the following:
# increase kernel buffer sizes for reliable packet capture
net.core.rmem_default = 33554432
net.core.rmem_max = 33554432
net.core.netdev_max_backlog = 10000
After you have added those entries, run the following to reload the settings: /sbin/sysctl -p
Installing the net flow add-on
3. Installing Splunk App for Windows Infrastructure
This should be a nice one, as I take we are all running the popular Active Directory from Microsoft. Before you install this app on your Splunk, you would need to download the following packages from the Splunk Base:
- https://splunkbase.splunk.com/app/1680 - The app itself, Splunk App for Windows Infrastructure
- https://splunkbase.splunk.com/app/742/ - The Splunk Add-on for Microsoft Windows (a prerequisite)
- https://splunkbase.splunk.com/app/1477 - The Splunk Add-on for Microsoft PowerShell
- https://splunkbase.splunk.com/app/3207/ - The Splunk Add-on for Active Directory
- https://splunkbase.splunk.com/app/1151/ - The Splunk Supporting Add-on for Active Directory
- https://splunkbase.splunk.com/app/3185/ - The Splunk Add-on for Microsoft IIS
- https://splunkbase.splunk.com/app/1914/ - The Splunk Add-on for Microsoft Sysmon
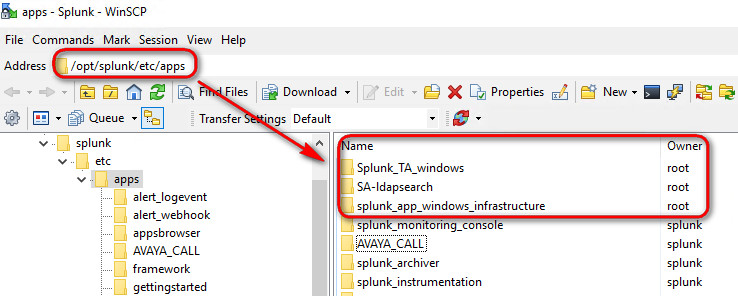
Once you unzip all of these goodies, use WinSCP an put all of them in the mighty folder /opt/splunk/etc/apps (on the screenshot below I've only shown a few)
Again, once the folders have been copied, ensure you run the following in the apps folder to give full permission to the Splunk account
chown splunk:splunk -R *
Guess what? Yes! after all above... restart Splunk

Now that you have copied all the apps into the .../etc/apps, it is time to do the same thing but from the clients point of view
3.1 Configuring the deployment-apps
The Universal Forwarder is the application that we install in the Forwarder, so that it sends the logs and data to the Indexer. Get the download from here (https://www.splunk.com/en_us/download/universal-forwarder.html) and install it in all the Windows Servers from where you want to gather information, domain controller, printer servers, wsus servers, etc
Install the Splunk Universal Forwarder on the FRDC and configure its "deploymentclient" file under C:\Program Files\SplunkUniversalForwarder\etc\system\local to point to the Splunk server IP address and port 8089
- Copy the "Splunk_TA_windows" app into the /opt/splunk/etc/deployment-apps of your Splunk Server
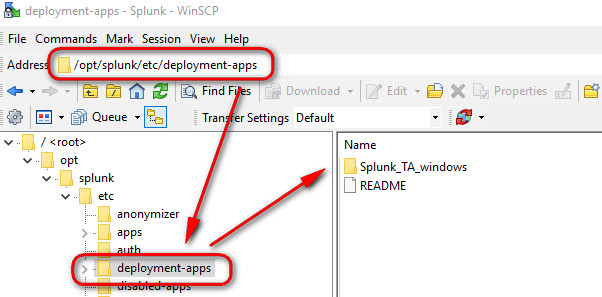
After you have added the app, visit Settings > Forwarder Management and verify that the client FRDC is listed, it should be listed because you install the Universal Forwarded on it and it reported to Splunk using 8089
Create a new "Server Class" and give it a meaningful name to host the App and the machines related to the app, on my example I called "Windows_AD"
3.2 Configuring the Splunk App for Microsoft Windows
Before jumping into the configuration, do as follows:
- Visit you Active Directory and create a standard user account under the OU "Users", I called that account "Splunk", and it will be used to search AD data on behalf of Splunk
- Configure Splunk to received data by creating a stanza under opt/splunk/etc/system/local
[splunktcp://9997]
disabled = 0
Now we are ready to configure the app,
- Visit the configuration tab of this app and configure the details for your domain as follows, on my example my domain could have been "london.mydomain.local"
- The "Alternate domain name" means the NETBIOS of the domain
- For the hostname of the LDAP server you can use the name of the FRDC (Forest-Root DC), but I decided to use its IP instead, fail proof!
- On your Splunk web GUI, visit Settings > Data Inputs >

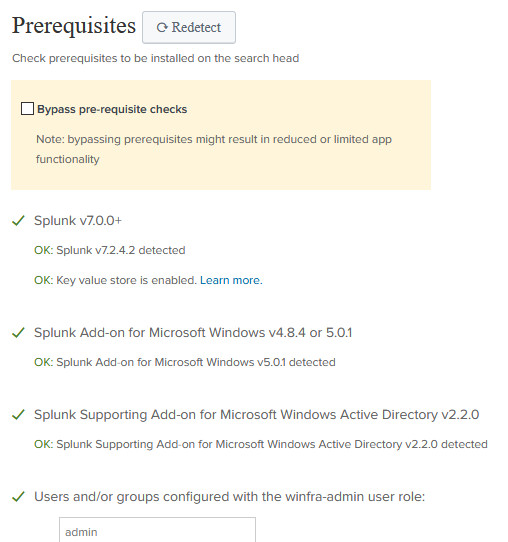
Once this is done, visit the "Splunk App for Windows Infrastructure" and ensure all the prerequisites are met
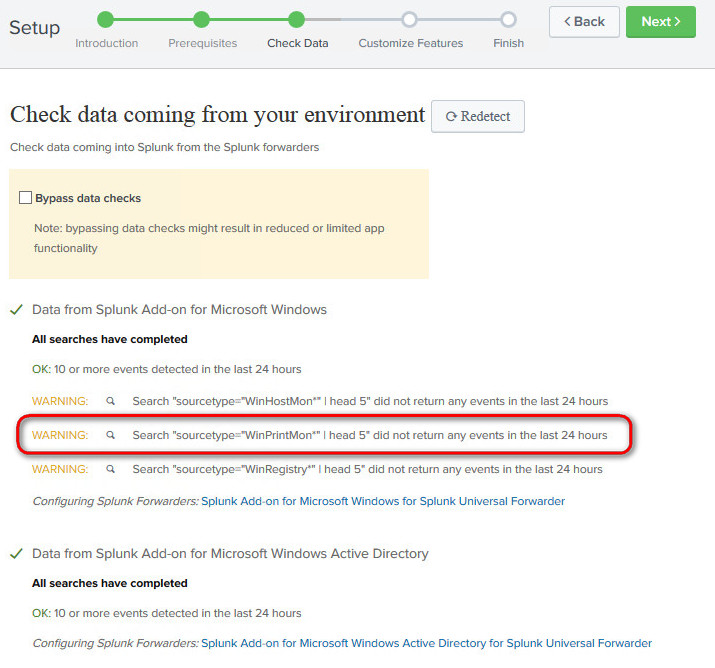
On the next windows, you most likely will get an error of some sort saying that the " Search "sourcetype="WinPrintMon*" | head 5" did not return any events in the last 24 hours"; this means that your Indexer is not getting the data related to those events. For example, on the screenshot below I've highlighted the "WinPrintMon" source type, indicating that the Indexer is not receiving any print monitoring data from, let's say, your print server. If you know for sure you have installed the Universal Forwarder on your print server, you might wonder: why my expected sourcetype data is not getting into the Indexer?
One of the most common problems is that the client is not actually configured to send to the Indexer the relevant data. To fix this, ensure that the inputs.conf file on the client (located in C:\Program Files\SplunkUniversalForwarder\etc\system\local) is configure to send the data that you need; in the example below I've added the stanzas needed to send the relevant data to the Indexer
[default]
host = MY-PRINT-SERVER
[WinPrintMon://printer]
type=printer
interval=600
baseline=1
disabled=0
[WinPrintMon://driver]
type=driver
interval=600
baseline=1
disabled=0
[WinPrintMon://port]
type=port
interval=600
baseline=1
disabled=0
[WinPrintMon://jobs]
type=job
interval=60
baseline=0
disabled=0
Splunk will use the "main" index by default, putting all data in there, which inevitably will become messy in the future, so please ensure from the start that you carefully created a dedicated index for each App that you're going to install on Splunk. Create a naming convention for your indexes and stick to it! To fix the warning related to the "WinHostMon", add the following entries into the inputs.conf file of the client forwarders
# Queries computer information.
[WinHostMon://computer]
type = Computer
interval = 300
# 'interval' set to a negative number tells Splunk Enterprise to run the input once only.
[WinHostMon://os]
type = operatingSystem
interval = -1
[WinHostMon://processor]
type = processor
interval = -1
[WinHostMon://disk]
type = disk
interval = -1
[WinHostMon://network]
type = networkAdapter
interval = -1
# This example runs the input ever 5 minutes.
[WinHostMon://service]
type = service
interval = 300
[WinHostMon://process]
type = process
interval = 300
For the network monitor, you can add this entry in the inputs.conf if you like, that should gather plenty info in regards to your network traffic
[WinNetMon://winnetmon]
direction = inbound;outbound
disabled = 0
index = windows
packetType = accept;connect
If you have a server running IIS, add this stanza to the inputs file in C:\Program Files\SplunkUniversalForwarder\etc\system\local ,then restart the splunk service
Install as well this app on your indexer, it works in conjunction with the IIS add-on that we should have installed already: https://splunkbase.splunk.com/app/4117/ - Firegen for Microsoft IIS
Create also an index called "iis" and link it to the Firegen for Microsoft IIS app
[monitor://C:\inetpub\logs\LogFiles]
disabled = false
index = iis
sourcetype = ms:iis:auto
Any problems... visit the Splunk Tips & Tricks, it is really awesome :) https://www.splunk.com/blog/tag/splunk-universal-forwarder.html
References
- Great article this one: https://www.splunk.com/blog/2014/04/21/windows-print-monitoring-in-splunk-6.html and this one almost too: https://docs.splunk.com/Documentation/Splunk/latest/Data/MonitorWindowshostinformation
One small tiny little note at the end.... you may...ejem, you may watch out for the license that you have in your Splunk, the settings I listed will fill up about 10GB of data a day for 10 servers or so. Remote stanzas from the output.conf file if you're struggling with the amount of logs logged
Installing "Analytics for Linux"
Download and install the app from this location:
https://splunkbase.splunk.com/app/3777/ - Analytics for Linux
https://splunkbase.splunk.com/app/3117/ - Horizon charts
https://splunkbase.splunk.com/app/3166/ - Horseshoe Meter
#yum install collectd-apache
#yum install collectd-nginx
https://www.katana1.com/news/splunk-metrics-ftw
Configure the Indexer for collectd
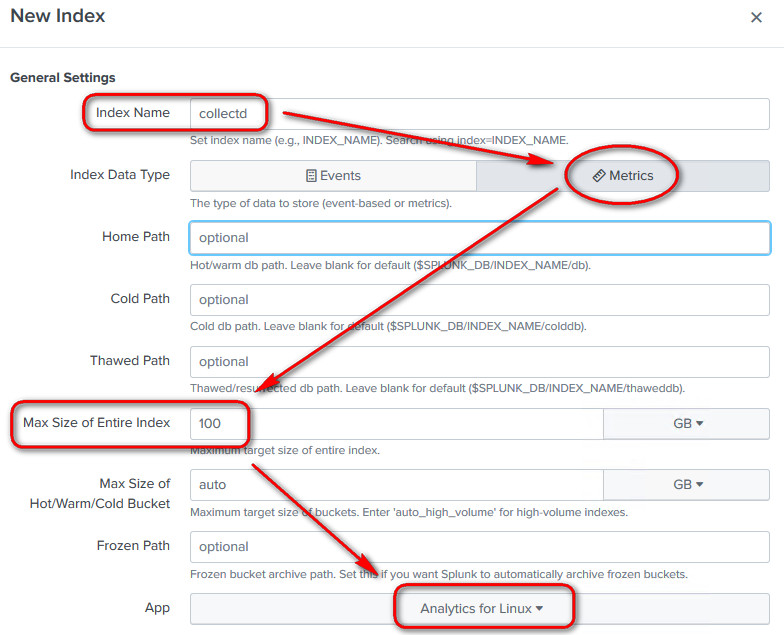
Now visit your Indexer and create a new index with data type metric called "collectd", associate it to the Analytics for Linux app
Still in your Indexer, visit Settings > Data inputs > HTTP Event Collector, click on Global setting and enable it, taking note of the port in use, we'll need that port number later to configure collectd

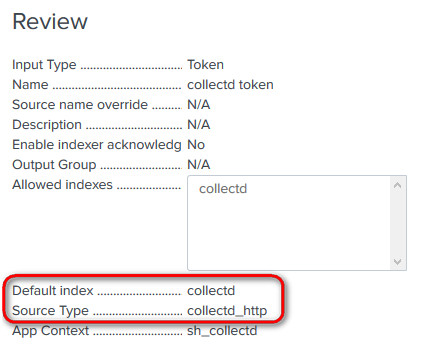
Create a new token called "collectd token", selecting the "collectd" as the Index and the Source Type as Metrics > collectd_http
Documentation about the collectd command can be found here: https://collectd.org/documentation/manpages/collectd.conf.5.shtml
In my test environment, the app is getting data, and I can see it in Metrics > Metric Explorer, but the dashboard graphs are not populated for some reason, hope you had a better luck!
5. Installing Splunk app for Unix
Now that we got all the Windows servers under control, let's go and add our Linux servers to Splunk too. Download this app to get started:
- https://splunkbase.splunk.com/app/273 - Splunk app for Unix
- https://splunkbase.splunk.com/app/833/ - Splunk Add-on for Unix and Linux
Install both of these packages (the app and the add-on) in your Indexer, by copying them into the so famous /opt/splunk/etc/apps, then issue this command to ensure the splunk account have got access to it:
chown splunk:splunk -R *
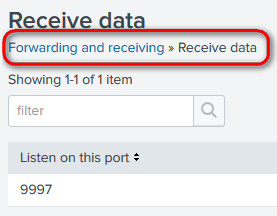
Needless to say that you should have already configured your Indexer to receive data on the port 9997
No need to restart Splunk just yet, wait until we fully configure the app!
5.1 Create a new Linux index
Visit Settings > Indexes and create a new index called "linux_os", link it to the "splunk_app_for_nix" app

5.2 Configure the app conf file in the Indexer
Once you have installed the "splunk_app_for_nix" in your Indexer, visit the folder "default" within the app and copy the macros.conf and savedsearches.conf into the local folder, like this:
#Ensure you are in /opt/splunk/etc/apps/splunk_app_for_nix/default
cp savedsearches.conf /opt/splunk/etc/apps/splunk_app_for_nix/local
cp macros.conf /opt/splunk/etc/apps/splunk_app_for_nix/local
#If prompted, say "yes" to override
Now, in the local folder, edit the "macros.conf" file so that index=linux_os

Still in the local folder, edit the "savesearches.conf" file and add the "linux_os" index in the [fired_alerts] stanza

5.3 Install Splunk Universal Forwarded in a Linux Machine
Aha! for that bit visit the section 4 of this my other article: https://www.nazaudy.com/index.php/16-linux/36-install-squid-webmin-and-sent-data-to-splunk-with-centos-7 Ensure that you have executable permissions for the scripts under /opt/splunkforwarder/etc/apps/Splunk_TA_nix/bin ,if not run this command to make it executable:
chmod ug+x *.sh
#Run the above command when you are in the Splunk_TA_nix/bin folder
If you don't see the Forwarded in the "Forwarder Management" of the Indexer, ensure your deploymentclient.conf in the folder /opt/splunkforwarder/etc/system/local
[deployment-client]
disabled = 0
[target-broker:deploymentServer]
targetUri = 192.168.0.40:8089
5.4 Configure the add-on in the Forwarder
In the Linux VMs where you have installed the Splunk Forward, issue the following:
yum -y install net-tools
yum -y install sysstat
yum -y install lsof
yum -y install ntpdate
yum -y install nfs-utils
Next, copy the "Splunk_TA_nix" app into your forwarded in the location /opt/splunkforwarder/etc/apps , yeah, in theory the deployment server should do that for you but just in case the app is not in that folder, copy to it manually. Then, create a inputs.conf file in the location /opt/splunkforwarder/etc/apps/Splunk_TA_nix/local and populate the file with these settings:
[default]
host = YourLinuxNameServer
[monitor:///etc]
disabled = false
index=linux_os
[monitor:///home/*/.bash_history]
disabled = false
index=linux_os
[monitor:///Library/Logs]
disabled = false
index=linux_os
[script://./bin/cpu.sh]
disabled = false
index=linux_os
[script://./bin/bandwidth.sh]
disabled = false
index=linux_os
[script://./bin/df.sh]
disabled = false
index=linux_os
[monitor:///root/.bash_history]
disabled = false
index=linux_os
[monitor:///var/adm]
disabled = false
index=linux_os
[monitor:///var/log]
disabled = false
index=linux_os
[script://./bin/hardware.sh]
disabled = false
index=linux_os
[script://./bin/interfaces.sh]
disabled = false
index=linux_os
[script://./bin/lastlog.sh]
disabled = false
index=linux_os
[script://./bin/iostat.sh]
disabled = false
index=linux_os
[script://./bin/netstat.sh]
disabled = false
index=linux_os
[script://./bin/lsof.sh]
disabled = false
index=linux_os
[script://./bin/nfsiostat.sh]
disabled = false
index=linux_os
[script://./bin/openPorts.sh]
disabled = false
index=linux_os
[script://./bin/openPortsEnhanced.sh]
disabled = false
index=linux_os
[script://./bin/package.sh]
disabled = false
index=linux_os
[script://./bin/passwd.sh]
disabled = false
index=linux_os
[script://./bin/protocol.sh]
disabled = false
index=linux_os
[script://./bin/ps.sh]
disabled = false
index=linux_os
[script://./bin/rlog.sh]
disabled = false
index=linux_os
[script://./bin/selinuxChecker.sh]
disabled = false
index=linux_os
[script://./bin/service.sh]
disabled = false
index=linux_os
[script://./bin/sshdChecker.sh]
disabled = false
index=linux_os
[script://./bin/time.sh]
disabled = false
index=linux_os
[script://./bin/top.sh]
disabled = false
index=linux_os
[script://./bin/update.sh]
disabled = false
index=linux_os
[script://./bin/uptime.sh]
disabled = false
index=linux_os
[script://./bin/usersWithLoginPrivs.sh]
disabled = false
index=linux_os
[script://./bin/version.sh]
disabled = false
index=linux_os
[script://./bin/vmstat.sh]
disabled = false
index=linux_os
[script://./bin/vsftpdChecker.sh]
disabled = false
index=linux_os
[script://./bin/who.sh]
disabled = false
index=linux_os
Restart the local splunk in the forwarded and wait to see the magic happening in app Indexer!
The Splunk Infrastructure
I'd recommend you to get 2 x licenses for Splunk, yes, you head me well, 2 x licenses (unless you're illegal and decide to install the same license on two machines), and get one Splunk -Indexer- instance to welcome all the logs from Servers, while the other one can be configure to receive logs from Client and peripherals.
Comments powered by CComment