Enable NetFlow V9 in Cisco Switches with PRTG
In this article we will explore what I did to enable NetFlow version 9 in our Cisco switches, to work in conjunction with a PRTG system. It is advisable to enable NetFlow V9 in Cisco Switches with PRTG, so you not only monitor the traffic but also the "source" and "destination" IP addresses from which the traffic is generated, giving you a better insight of what is happening in your network, and whom or what is utilising the bandwidth
The principle of this configuration can be organised in two blocks, the first one deals with your Cisco switches and the second one with the PRTG console. In the first section we'll do the following in the Cisco switches:
- Create a flow record
- Create a flow exporter
- Create a flow monitor
- Configure a sampler for packets
- Configure the interfaces to send flow data
- Configure DNS and SNMP in your Cisco switch
For the second part of this article, we will cover the PRTG configuration, as follows:
- Set Mbits units for your PRTG
- Ensure the channels you're monitoring are 64-bit
- Add the NetFlow V9 sensor
- Add Source and Destination IP Toplist
- Set Primary Toplist
- Create a NetFlow V9 PRTG map
Important note: which Cisco switches are compatible?
I have tested these settings with Cisco C2960X, C3850 and C9300, in devices with the newer IOS 15.0(2a) EX5 and 03.07.04E, and the configuration works really well
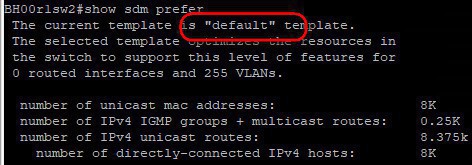
In older IOS switches (like the C2960S) you will get the error "(%Unrecognized command)" when issuing the command (config)#flow? , and only the flow sampler comes up. For these type of switches, where you're missing the flow command, verify first of all which type of "sdm template" (Switch Database Management) you are using by entering this command:
show sdm prefer
If it shows that the "default" template is in use, you would need to update the firmware of the switch to a "lanbase-default" IOS
Follow my other article about how to upgrade the IOS in your switch: http://www.nazaudy.com/index.php/12-technology/cisco/35-upgrade-ios-in-cisco-switches-c2960s , and see if your unit support IOS version 15.0(2)EX5 so that you have the "flow" command available and are clear to proceed
One more thing, as you know well with Cisco, most of the cool features are bound to....yeap... licensing. Some Cisco switches will support NetFlow but will only capture input traffic while the output traffic is reserve by those who dare to buy the license for their devices. Have a look at this great matrix to find out under which category your switch falls into: https://community.cisco.com/t5/security-documents/netflow-support-matrix/ta-p/3644638
A good rationale presented by Praveen Manohar about this situation of monitoring the NetfFlow traffic only in one direction can be read here:
In order to enable NetFlow V9 in Cisco Switches with PRTG, start by logging to your Cisco switch and enter this in global configuration mode (config)#
flow record PRTG-FLOW-RECORD
description Record-Network-Traffic
match ipv4 tos
match ipv4 protocol
match ipv4 source address
match ipv4 destination address
match transport source-port
match transport destination-port
collect transport tcp flags
collect counter bytes long
collect counter packets long
collect timestamp sys-uptime first
collect timestamp sys-uptime last
Type "exit" to go back to (config)# mode, then copy and paste the code below, ensuring that you use your own management vlan (in my example is vlan 41) and the IP address of your PRTG server (192.168.0.41 in my example). For transport UDP, use the default port 9997
flow exporter PRTG-EXPORTER
description Export-Flow-to-PRTG
destination 192.168.0.41
source vlan41
transport udp 9997
Type "exit" again, and paste the following code to create a flow monitor. In the example I use a cache timeout of 60 seconds, meaning that after this time the collected data in the switch cache will be sent to the PRTG exported; the longer the cache the more load you will incur on your switches
flow monitor PRTG-MONITOR
description Monitor-PRTG-Flow
record PRTG-FLOW-RECORD
exporter PRTG-EXPORTER
cache timeout active 60
4. Configure a sampler for packets
Type "exit" one more time, and then paste the code below, resulting in a Sampler monitoring 1 packet out of a window of 32 bytes. This will help us later to tunnel the data to our PRTG server
sampler PRTG-SAMPLER
mode random 1 out-of 32
5. Configure the interfaces to send flow data
Finally, select all of the physical interfaces in your switch (do int rang g10/01 - 28 or similar) and issue this command so that they start monitoring NetFlow traffic:
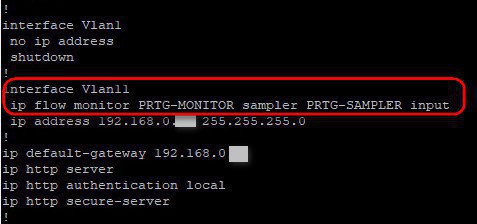
ip flow monitor PRTG-MONITOR sampler PRTG-SAMPLER input
- If you get the error message: "Flow Monitor: Flow Monitor 'PRTG-MONITOR' can't be applied on switch 1", then make sure that you don't have the "ip flow egress/ingress" configured on any of the interfaces
- You do not need to add the above line into your any of your port-channels, if you have created any
- You do need to add, however, the above ip flow monitor command to your management vlan, and whichever other interface vlan you have configured an IP address in
6. Configure DNS and SNMP in your Cisco switch
Before we jump into the PRTG configuration, let's ensure that your Cisco switch can resolve names by issues these commands; the first 2 lines will help the switch resolve names (replace nazaudy.local for your current Active Directory domain name), the name-server and ntp server should both point to your Forest Root Domain Controller, and finally add as well an ip default-gateway pointing to your router
ip domain-name nazaudy.local
ip domain-lookup
ip name-server 192.168.0.10
ntp server 192.168.0.10
ip default-gateway 192.168.0.1
Enter the following commands too, where 192.168.0.27 is the IP of your PRTG server and "Nazaudy" is the community name for your SNMP settings. The below commands will ensure that the SNMP traffic generated by your Cisco switch is reachable only by your SNMP server
logging host 192.168.0.27
access-list 1 remark Restric-access-to-snmp
access-list 1 permit 192.168.0.27 0.0.0.255 log
snmp-server community Nazaudy RO 1
At this stage, you can execute #show logging in your Cisco switch, and hopefully you'll see some NetFlow traffic going to your PRTG server

1. Set Mbits units for your PRTG
Jumping now to your PRTG system, we are going to explore now the last part about how to enable NetFlow V9 in Cisco Switches with PRTG. The first thing we should do is to ensure that the units in use by our network switches are all set to Mbits per second. To do that, edit the group in PRTG where (I suppose, and I hope so!) all your network switches are grouped into, and modify the "Channel Unit Configuration" to read as follows:
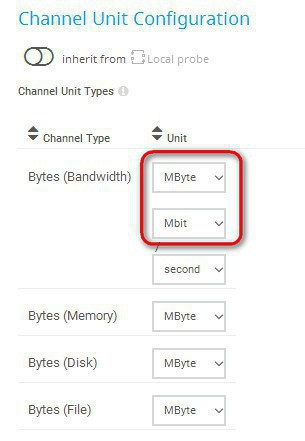
This way, PRTG will nicely show you all your traffic in Mbits, rather than the default of Kbits which is quite confusing

2. Ensure the channels you´re monitoring are 64-bit, and use SNMP v2 or v3
I take it your computer runs at 64-bit, therefore ensure that when you add channel sensors to your cisco device in PRTG, there are all set to 64-bit, otherwise they'll give you incorrect data. Just remember that SNMP v1 does not support 64-bit, therefore please ensure that you're using either SNMP v2 or v3 to monitor your Cisco devices
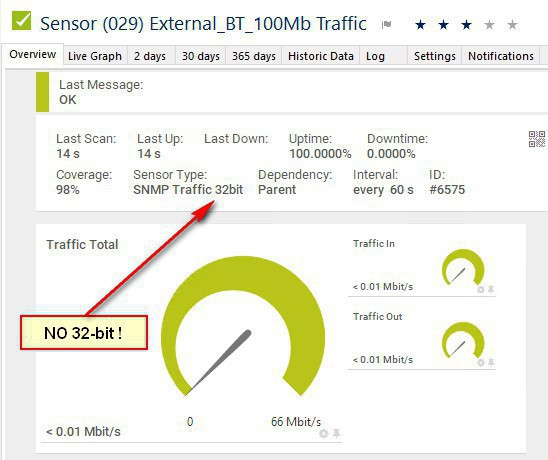
If you happens to have a 32-bit sensor, just delete it and add it again; it should add as a 64-bit sensor instead
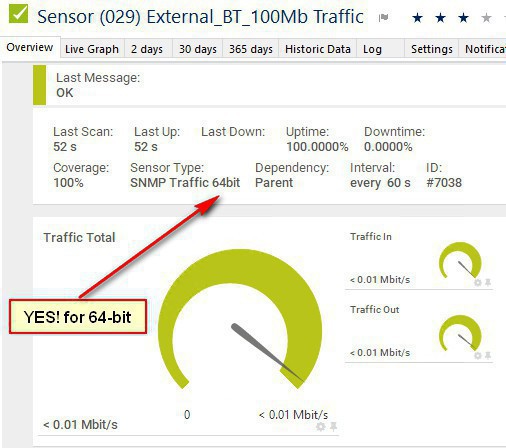
HP Pro Cover Switches and Aruba consideration: if you happen to have those switches on your network, leave the 32-bit sensor on; these switches operate using SNMP v1 which only reports at 32-bit. More info here: https://blog.paessler.com/the-64-bit-counter-mystery-trouble-with-a-hp-procurve-gigabit-switch
Once you have added your Cisco switch device in PRTG, right-click on it and choose "add sensor", then add the NetFlow V9 sensor, and configure it with these settings:
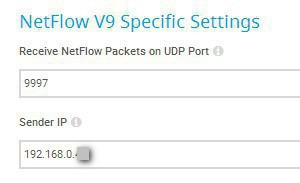
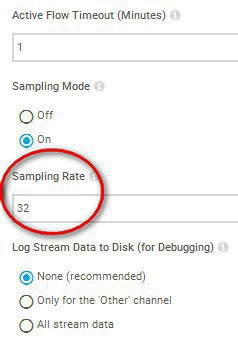
And yes, set the Sampling Mode to "on", and ensure the Active Flow Timeout is set to 1 minute, and the "Sampling Rate" set to 32, just as we configured our sampler PRTG-SAMPLER in the Cisco switch earlier
4. Add Source and Destination IP Toplist
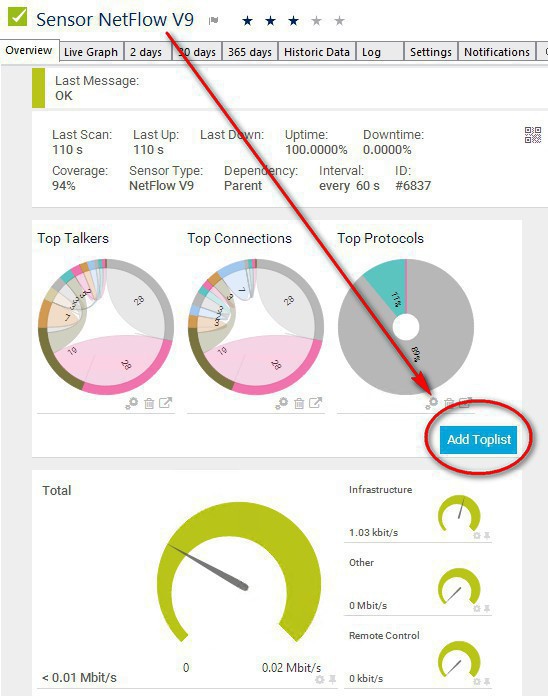
Wait for a bit until you start receiving data in your PRTG (the sensor should turn on green), then click on the "Add Toplist" button in the NetFlow V9 sensor:
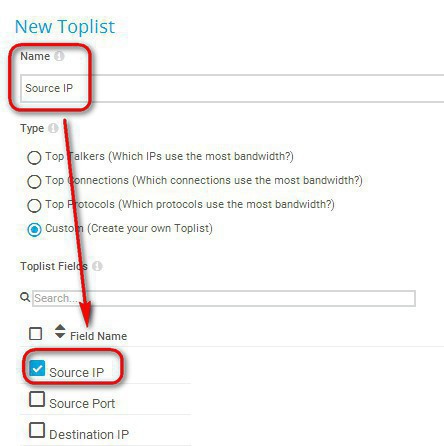
Name your toplist "Source IP", then select "Custom" in the type of traffic and tick the "Source IP" filed name
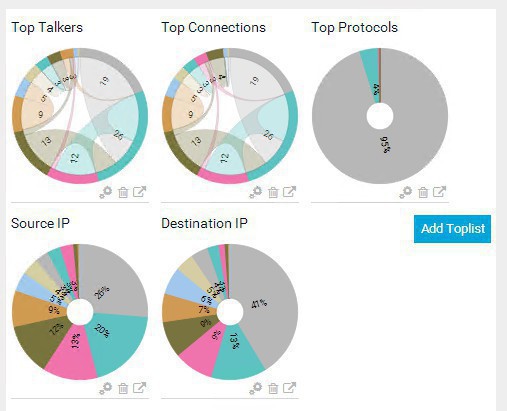
Do the same thing for "Destination IP", so that at the end you end up with the configuration below, where you can see separate entities for both Source and Destination IP:
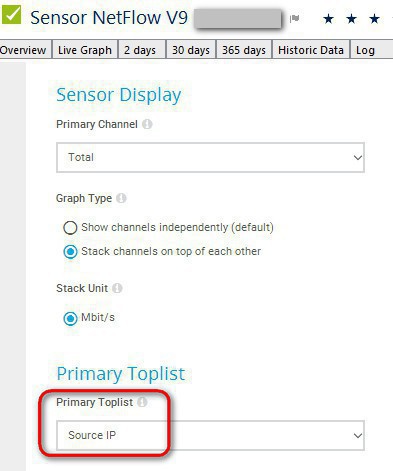
Visit your NetFlow V9 sensor > Settings and set the Primary Toplist to be your "Source IP", this is so that on the maps we can see the IP address from which the traffic is coming from, singling out any possibly misuse of the bandwidth. If you want, of course, you can choose the "Destination IP" toplist instead to be your default. I much prefer the Source IP
We are now ready to do the most exciting part of this configuration: the PRTG maps! yay! :)
6. Create a NetFlow v9 PRTG map
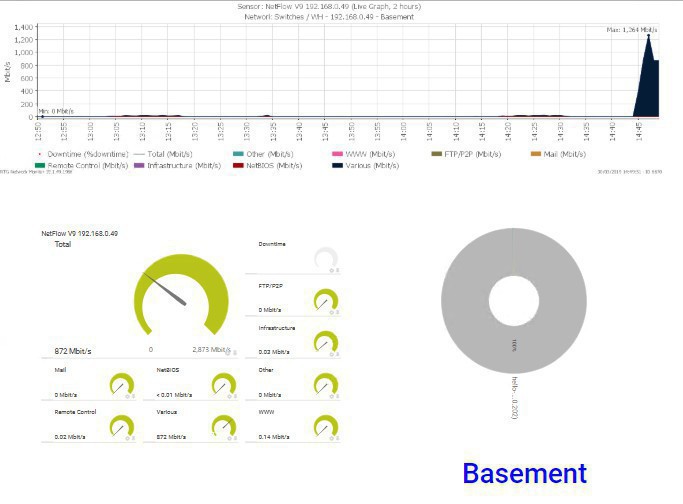
Add a new map to your PRTG "maps" section, and when ready drag the item Graphs > Live graph (large fonts) in the white space of the Map Designer area. Then on the "Device Tree", look for the Netflow sensor of the device you're creating the map for, and drag the sensor over the "live graph (large fonts)" item
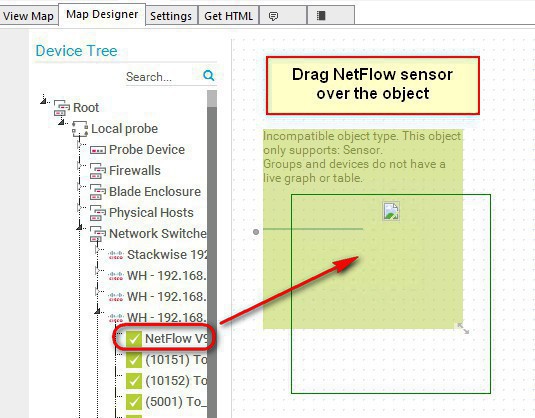
Do the same thing for 2 x more objects:
- Drag the object Graphs > Primary toplist of a sensor, and put on it the NetFlow V9 sensor
- Drag the object Status Icons > Channel (gauges), and put on it the NetFlow V9 sensor
- Drag a Custom HTML > Custom HTML Element, and edit its properties to fill it with these details:
- HMTL Before: <font size='14' color='blue'><b>Basement</b>
- HTML After:</font>
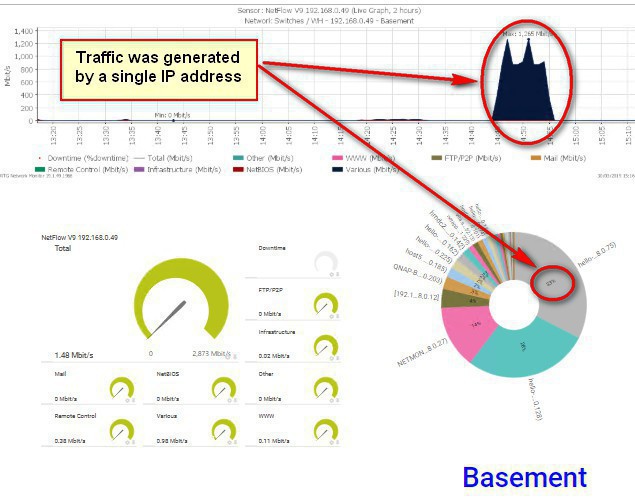
If all goes well, you will end up with this kind of graph, just change the "Basement" string on my example for the location of your choice; very well done! :) You can see on the graph below how a single IP address is using all of the bandwidth of the switch:
Here is the same graph, after the bandwidth process for that single IP address was stopped
Thank you for reading!
If you enjoyed this article of mine about Enable NetFlow V9 in Cisco Switches with PRTG, I recommend you to please follow this other article "Use rConfig to manage your Cisco switches and Cisco tips" for more ideas and tips about Cisco switches: https://www.nazaudy.com/use-rconfig-to-manage-your-cisco-switches-and-cisco-useful-tips
London, 30 March 2019
References
- https://www.cisco.com/c/en/us/td/docs/ios-xml/ios/fnetflow/command/fnf-cr-book/fnf-cr-book_CLT_chapter.html
- https://supportforums.cisco.com/t5/lan-switching-and-routing/cannot-use-a-switchport-interface-as-source/td-p/2902234
- https://www.cisco.com/c/en/us/products/collateral/switches/catalyst-3560-cx-series-switches/q-and-a-c67-733230.html
- https://www.cisco.com/c/en/us/td/docs/ios-xml/ios/netflow/configuration/15-mt/nf-15-mt-book/cfg-nflow-top-talk.pdf
- https://kb.paessler.com/en/topic/66485-what-is-the-active-flow-timeout-in-flow-sensors
Comments powered by CComment